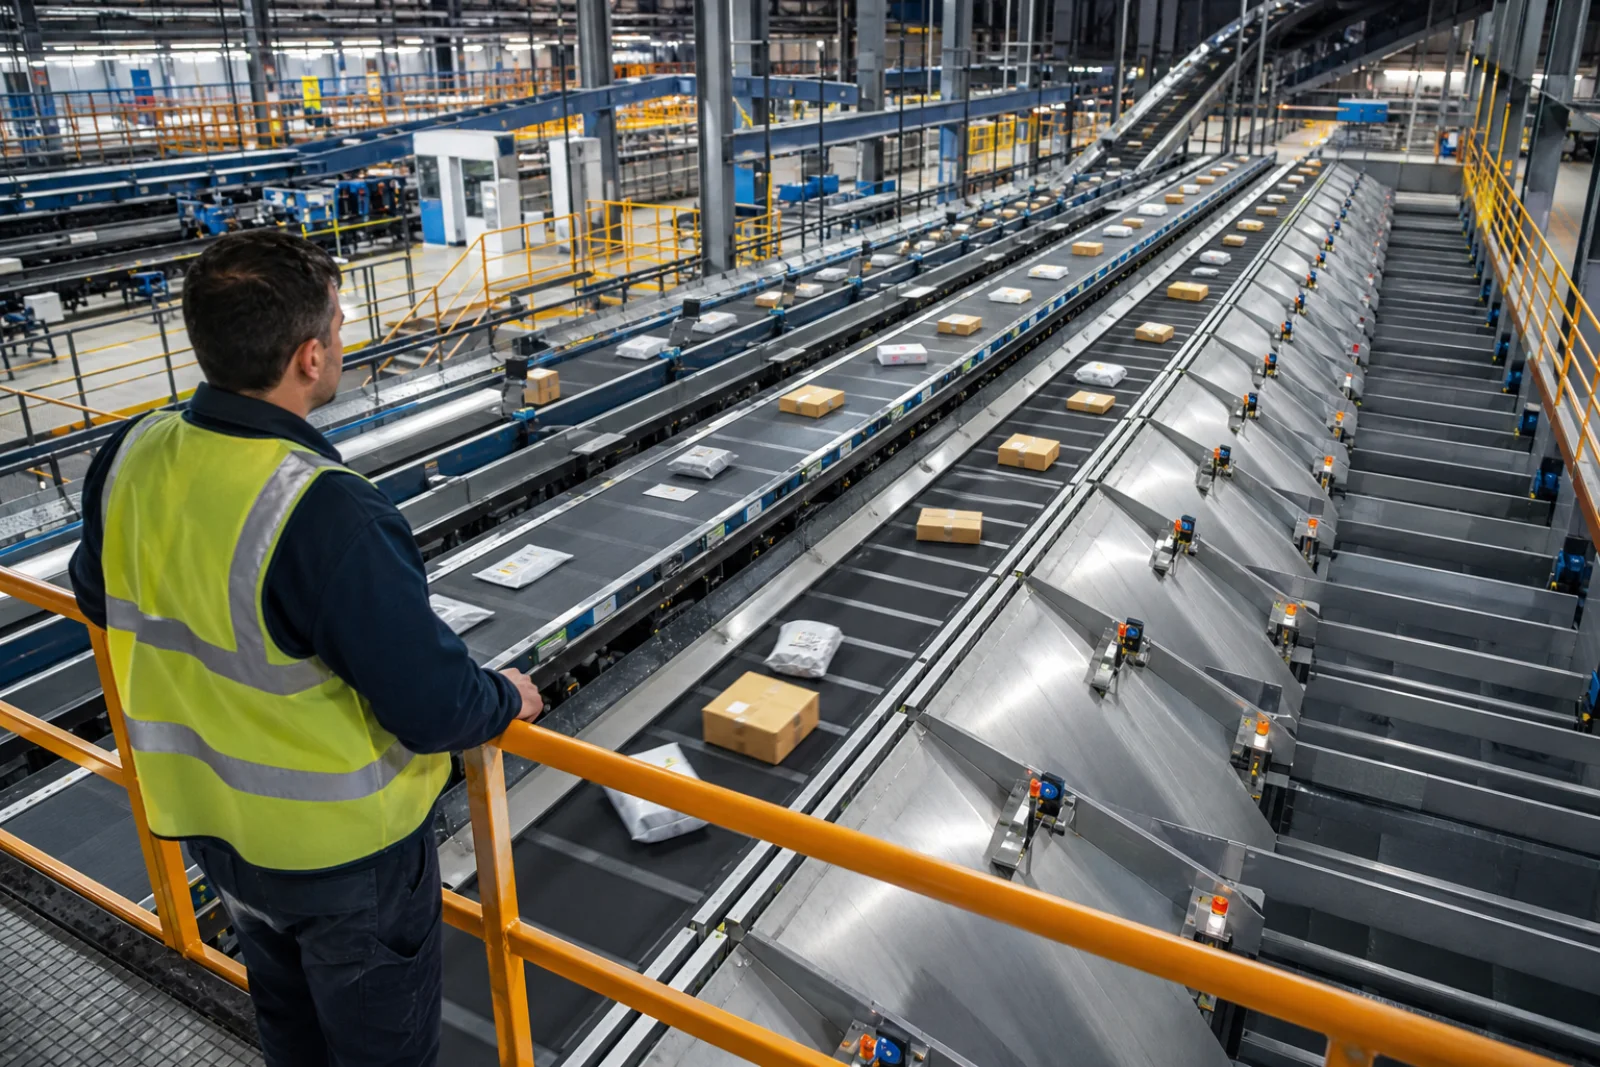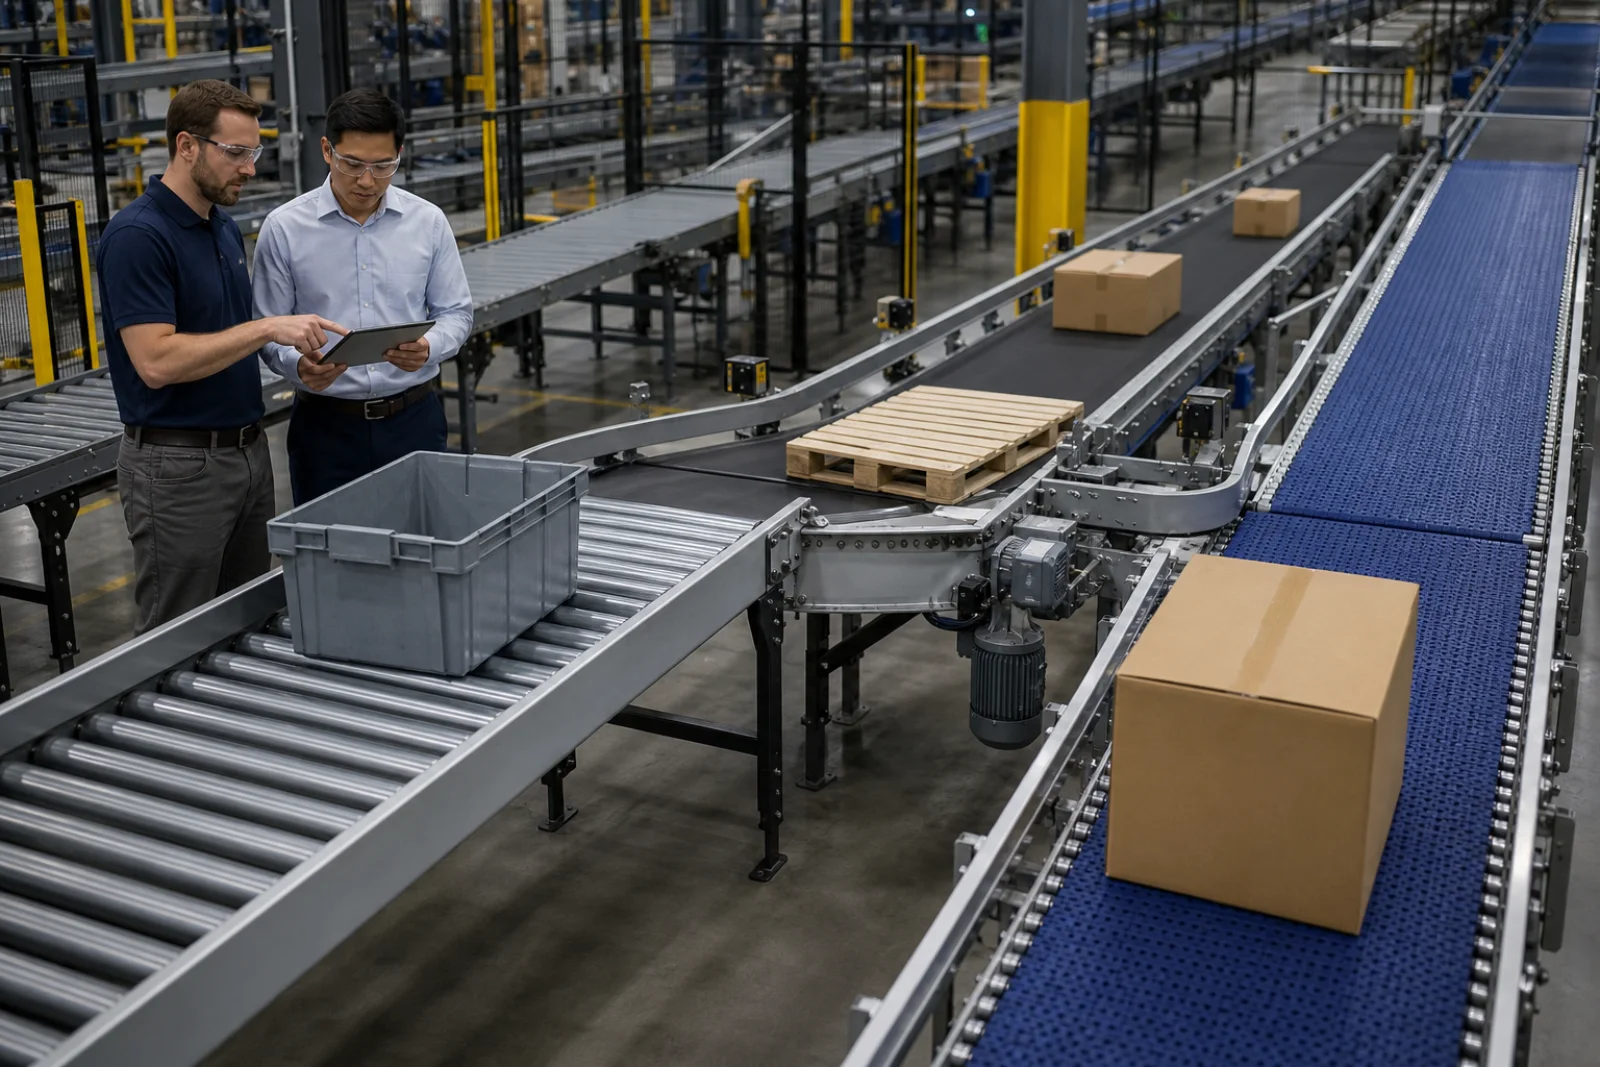







A warehouse automation investment is not simply an equipment-purchasing decision. It is a long-term operational decision that affects order fulfilment, shift requirements, inventory accuracy, space utilisation and growth capacity together. The answer to “How many years will the system take to pay for itself?” must therefore go beyond dividing the investment cost by current labour expenditure. A sound calculation measures today's losses, models realistic post-automation performance and compares capital and operating expenditure along the same timeline.
This guide explains, step by step, the data required to calculate the return on a warehouse automation investment, commonly overlooked costs, the financial value of capacity gains and how different scenarios should be tested. The objective is not to offer one universal “good ROI” percentage, but to build an auditable business case that allows management, operations, finance and engineering teams to work from the same assumptions.
Define the investment boundary correctly
The automation scope must be clear before ROI is calculated. Is the project limited to a conveyor line, or will the entire flow from receiving to dispatch change? Will the sorter, automated storage, mobile robots, picking stations, barcode reading and software integration be evaluated within the same investment? If scope is ambiguous, costs appear incomplete and benefits overly optimistic. The current and target states must be compared across the same process boundary.
A robust scope document clearly defines where products enter and leave the system, the product types to be handled, the target shift pattern, daily and peak volumes, WMS/WCS interfaces, and building and power works. Because the intralogistics process extends beyond automation equipment, supporting items such as fire scenarios, network infrastructure, operator areas and maintenance access must also be visible from the outset.
Establish the current-state cost baseline
Savings cannot be calculated without measuring performance before the investment. Collecting at least four to eight weeks of representative data is useful. Record daily order lines, cartons and pallets; hourly inbound and outbound distributions; picking distance; touches per item; error and rework rates; overtime; temporary labour; equipment downtime; and occupied space. Looking only at averages conceals campaign and seasonal peaks.
Labour cost must include not only net wages but also employer contributions, shift premiums, transport, meals, leave, training, recruitment, employee turnover and temporary-labour premiums. The baseline must also include maintenance, energy, rental and renewal costs for forklifts, pallet trucks, handheld terminals, racking, printers and packing equipment used in the manual process. This reveals the true annual expenditure that automation will replace.
Investment cost: what does CAPEX include?
Initial investment cost, or CAPEX, extends well beyond the price of the principal equipment. Mechanical equipment, electrical panels, field wiring, safety fencing, sensors, control software, WMS or WCS integration, server infrastructure, networks, installation, testing, commissioning, training and project management must all be included. Building reinforcement, floor improvements, sprinkler modifications or a mezzanine are also part of the investment where required.
A contingency allowance should be set according to the maturity of the scope. Uncertainty is higher during the concept phase and lower once detailed engineering is complete. Showing contingency separately instead of concealing it improves decision quality. Planned production losses during commissioning, temporary operating areas and parallel-operation costs must also be added to the model as cash outflows.
Operating expenditure: OPEX and total cost of ownership
Automation may reduce labour requirements, but it creates maintenance, spare-parts, software-licensing, energy, network, cybersecurity and specialist-support costs. Annual OPEX should cover preventive maintenance, breakdown response, critical spares, consumables, licence and support agreements, battery or belt replacement, and operator training. These costs may not increase linearly as the system grows.
Total cost of ownership is the sum of CAPEX and discounted OPEX over a defined analysis period. When choosing a five-, seven- or ten-year horizon, consider the equipment's economic life and the organisation's planning horizon. A solution that is inexpensive to purchase but maintenance-intensive may be costly over its lifecycle. Supplier proposals should therefore be compared using the same TCO template.
What constitutes the annual benefit?
The first benefit is direct labour savings. Roles that will genuinely be removed, reassigned or not recruited as the operation grows after automation must be listed separately. An assumption that “ten positions will be reduced” is unreliable unless those employees' duties and shifts are defined. Sometimes automation does not reduce headcount; it enables a higher volume to be managed by the same team. In this case, the benefit is modelled as avoided future recruitment.
The second benefit is a reduction in errors and rework. The cost of incorrect products, quantities or routes, lost cartons and damaged goods must include return transport, customer service, repicking, inventory correction and reputational impact. The third benefit is capacity. Deferred warehouse expansion, reduced reliance on external storage or an increased same-day dispatch rate made possible by higher hourly throughput can be assigned a financial value.
The fourth benefit is space utilisation. Automated storage systems can increase inventory density per square metre. If the released space can genuinely be reassigned to production, storage or dispatch, it has a rental or opportunity-cost value. The fifth benefit is occupational safety and ergonomics: accident frequency, heavy lifting, forklift traffic and walking distance may all be reduced. These values should be calculated conservatively using historical incident data and insurance costs.
Core financial metrics and formulas
The simple return on investment can be expressed as: ROI = (total financial benefit − total investment cost) / total investment cost × 100. The simple payback period is the initial investment divided by annual net benefit. For example, if the investment is TRY 30 million, annual gross benefit is TRY 10 million and additional annual operating expenditure is TRY 2 million, the annual net benefit is TRY 8 million and the simple payback period is 3.75 years.
Neither metric accounts for the time value of money. Net present value (NPV) and internal rate of return (IRR) should be used for long-life projects. The expected net cash flow in each year is discounted to the present using the selected discount rate. A positive NPV means the project generates value above the cost of capital used. IRR is the rate of return at which NPV becomes zero. The organisation's corporate discount rate and tax treatment should be supplied by the finance team.
Example warehouse-automation business case
Consider a warehouse processing 18,000 order lines per day, rising to 27,000 during peak periods. A total of 42 people work across three shifts in manual picking and sorting. Including overtime, temporary labour, errors and rework, the annual process cost is TRY 24 million. Assume the proposed conveyor, sorter and software investment is TRY 46 million, with total CAPEX reaching TRY 52 million after building works and contingency.
The new system's annual maintenance, energy and licence expenditure is projected at TRY 4 million. Expected annual benefits are TRY 11 million from labour and overtime, TRY 2 million from fewer errors, TRY 3 million from deferring external warehouse requirements and a conservative TRY 2 million from increased capacity. Gross annual benefit is therefore TRY 18 million and net benefit TRY 14 million. Simple payback is approximately 3.7 years. This result, however, depends on the capacity benefit genuinely becoming revenue or an avoided cost.
Take care when converting capacity gains into revenue
Being technically able to process twice as many items per hour does not automatically mean twice the revenue. Sales demand, inventory availability, transport capacity and order cut-off times must support that volume. Capacity benefit can therefore be divided into three groups: capacity that serves confirmed demand, investment avoided to accommodate forecast growth, and technical capacity with no current commercial value. The final group should not be entered at full value in the core ROI calculation.
Peak-capacity calculations must not be based on an average day. Hourly order-arrival curves, product mix, picking waves and carrier cut-off times should be simulated together. The nominal capacity of a sorter or conveyor will not be achieved if its induction and outlets cannot sustain the same rate. Bottleneck analysis is the technical validation of the financial model.
Build three scenarios: conservative, expected and strong
At least three scenarios should be prepared instead of a single forecast. The conservative scenario assumes lower volume growth, a longer commissioning period, a slower efficiency ramp and higher maintenance expenditure. The expected scenario is based on measurements and a validated proposal. In the strong scenario, volume and adoption increase more quickly, but the equipment's theoretical limit should still not be used. Management can then see whether the investment remains acceptable under adverse conditions rather than only in the best case.
In sensitivity analysis, labour cost, order volume, exchange rates, energy, maintenance, commissioning delay and system availability are varied individually. The variables with the greatest impact on NPV represent the project's principal risks. For example, if the outcome depends heavily on 99.5% availability, redundancy, maintenance organisation and contractual service times become critical.
Do not overlook the ramp-up period
Automation does not operate at target performance from day one. Operator training, product-master-data cleansing, mechanical adjustments, software rules and the maintenance team's learning curve require a ramp-up period. The financial model may assign progressive performance levels such as 50%, 70% and 85% to the first few months. Parallel operation of the legacy and new processes can also create duplicate operating costs.
An acceptance test that measures only instantaneous speed is insufficient. Volume, accuracy, availability and recovery scenarios must be validated together over a defined period. When KPIs are specified before contracting, the benefits in the investment model and the technical acceptance criteria are placed on the same foundation.
Common ROI mistakes
- Selecting a system around average volume while ignoring peak days.
- Using gross wages and underestimating the employer's total labour and shift costs.
- Omitting post-automation maintenance, licensing, energy and specialist-staff expenditure.
- Treating all theoretical capacity directly as additional sales.
- Leaving building, fire protection, network, data-cleansing and integration work outside the scope.
- Assuming 100% benefit during commissioning and the learning period.
- Treating exchange-rate and inflation effects differently in income and expenditure.
- Failing to measure realised benefits after the project.
Track benefits after the investment
The business case must not remain on a shelf as an approval document. Baseline KPIs are frozen before commissioning, and post-system measurements use the same definitions and time intervals. Hourly throughput, lines per person, order accuracy, availability, maintenance hours, energy, overtime and unit processing cost should be tracked monthly. The causes of deviations should be classified as volume, process, technology or organisation.
If the expected benefit is not realised, the first reaction should not be to blame the equipment. Product slotting, wave planning, shift start-up, replenishment discipline or a WMS rule may be limiting technical capacity. The continuous-improvement team should use automation data to reassess bottlenecks regularly.
Checklist before making the decision
Before presenting the case to management, the following questions should be answered: Is the scope boundary clear? Has data from at least one peak period been used? Have labour savings been validated by role and shift? Does CAPEX include building and integration work? Has five to ten years of OPEX been calculated? Has the commercial value of the capacity gain been demonstrated? Have ramp-up and parallel-operation costs been included? Does the project remain acceptable in the conservative scenario?
A properly prepared warehouse-automation ROI model does more than support the investment decision; it also defines the KPIs around which the design will be built and the results to be monitored after commissioning. An automation consulting approach can help you measure the process, select the appropriate combination of technologies and create a practical roadmap.
Frequently asked questions
What is the ideal payback period for warehouse automation?
There is no single ideal period. The cost of capital, industry risk, equipment life and growth plan are decisive. Organisations commonly compare NPV and IRR as well as simple payback against their corporate investment thresholds.
Does automation still make sense if headcount will not be reduced?
Yes. Accommodating growing volume with the same team, reducing overtime, improving accuracy, deferring investment in additional space and raising service levels are all substantial benefits. However, a measurable financial value must be stated clearly for each benefit.
How many years should an ROI calculation cover?
A period of five to ten years is generally used. It should be aligned with the equipment's economic life, software-renewal cycle, lease term and the organisation's strategic plan. Long-term maintenance renewals and residual value must not be overlooked.