






Disconnected data islands
Information in PLC, SCADA, meter, quality and business systems lives with different times, names and formats.
DataHub combines machine data, smart alarms and notifications, maintenance and spare parts, plus optional warehouse and dispatch processes on one on-premise platform.
Explore the solution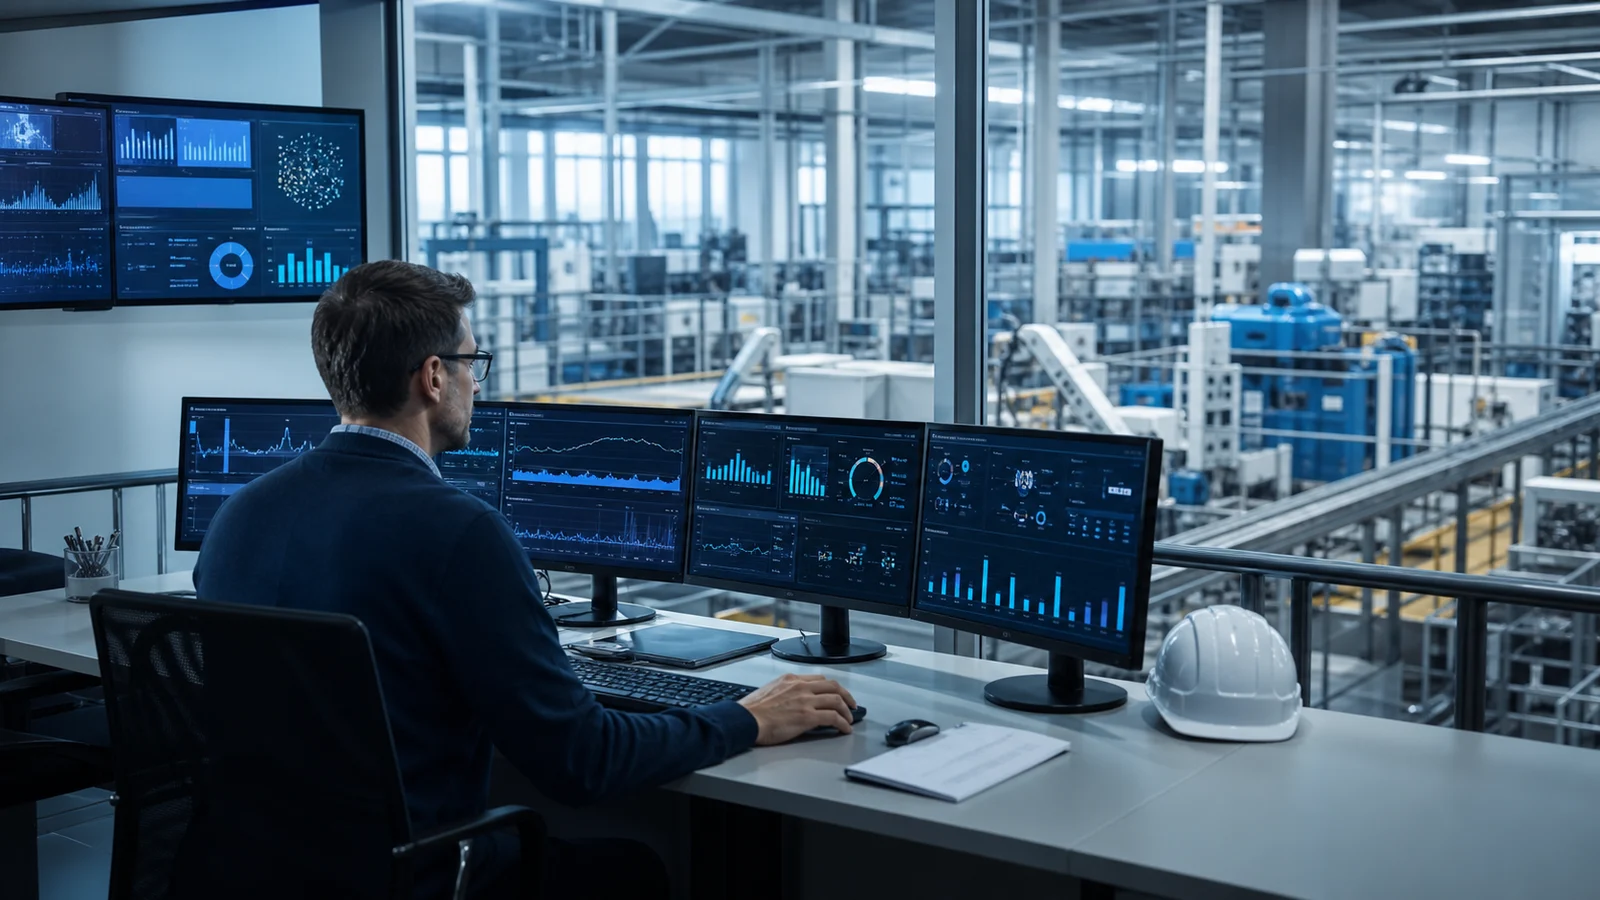
Information in PLC, SCADA, meter, quality and business systems lives with different times, names and formats.
Raw tag data; When it is not combined due to product, work order, shift, line and stop, it does not turn into a business decision.
The solution working on a single machine cannot be spread to the facility without a common standard, governance and scalable architecture.
Solution 4.0; It addresses field connectivity, edge processing, common data model, historical storage and enterprise system integration in a single architecture. The aim is not to establish a new data island, but to connect the existing PLC, SCADA, MES and ERP layers with a reliable data backbone.
Modules are enabled as needed. A structure that starts with one line and one critical rule can expand into maintenance, inventory, order and dispatch processes through the same data model.
Connection status, live values, history and related files are monitored in a plant, line, machine and device hierarchy from a single point.
Value, threshold and duration conditions are defined together. When an event occurs, the right team is notified by email, Slack, Telegram or an HTTP webhook.
The operations centre, alarm list, dashboards, users and permissions are managed in one interface, allowing teams to work from the same event record.
Maintenance records, part inventory and warehouse locations are linked to equipment, providing immediate access to the right history and available part during a fault.
Products, locations, inventory, dispatch orders, picking, packing and mixed-pallet planning can be activated on the same platform as required.
With Turkish, English and German interfaces, the plants, modules and actions available to each user are restricted by role.
The animation shows the reliable reception of the field signal at the edge, enriching it with the production context and distributing it to different operational applications through the same model.
Each capability can be deployed as an independent project; but the data model and integration principles are jointly designed from the beginning.
Reliable data collection from PLC, CNC, robot, SCADA, energy analyzer and databases.
Network and center with filtering, calculation, buffering and local rules reducing the load.
Standardization of tags with asset, location, product, shift and work order context.
Queryable, traceable and scalable storage of high-frequency process data.
Controlled data exchange with MES, ERP, WMS, quality, maintenance, cloud and data lake systems.
Role-based dashboards, notifications, calculated KPIs and operations support applications.
DataHub combines a machine signal with its operational context. The rules engine evaluates value, duration and equipment status together; it records the alarm, shows the event on the trend and sends a notification through the selected channel.
Live Data · Assets · Rules · Alarms · Operations
When production, energy, quality and maintenance data are displayed in the context of common time and equipment, teams work with the same reality; cause of deviation becomes visible faster.
Filling-02Micro stance · 02:14
Packing-01Speed below target
EnergyShift base load +6%
A PLC, SCADA, meter, database or business system is brought into the platform through the appropriate industrial protocol or interface.
Signals are organised with meaningful names and units in a plant, line, machine and device hierarchy.
Value, duration and state conditions such as “current remains above 20 for five seconds” are configured without writing code.
The data and exact time that triggered the alarm are shown on the historical trend, making threshold reviews evidence-based.
The notification is routed to the relevant team and channel; users see only the plants and events for which they are authorised.
The validated structure extends to new machines, maintenance records, inventory and dispatch operations through the same core.
Cycle, speed, downtime and quality losses on line, product, shift and cause basis visibility.
Comparison of electricity, gas, water and auxiliary facility consumption with production quantity and equipment status.
Maintenance workflows of meters, alarms, operating time and process deviations feed.
Associating product, recipe, material, process value and quality result on the time line.
Customer and facility information has been anonymized to meet confidentiality obligations.
 ANONYMOUS PROJECT
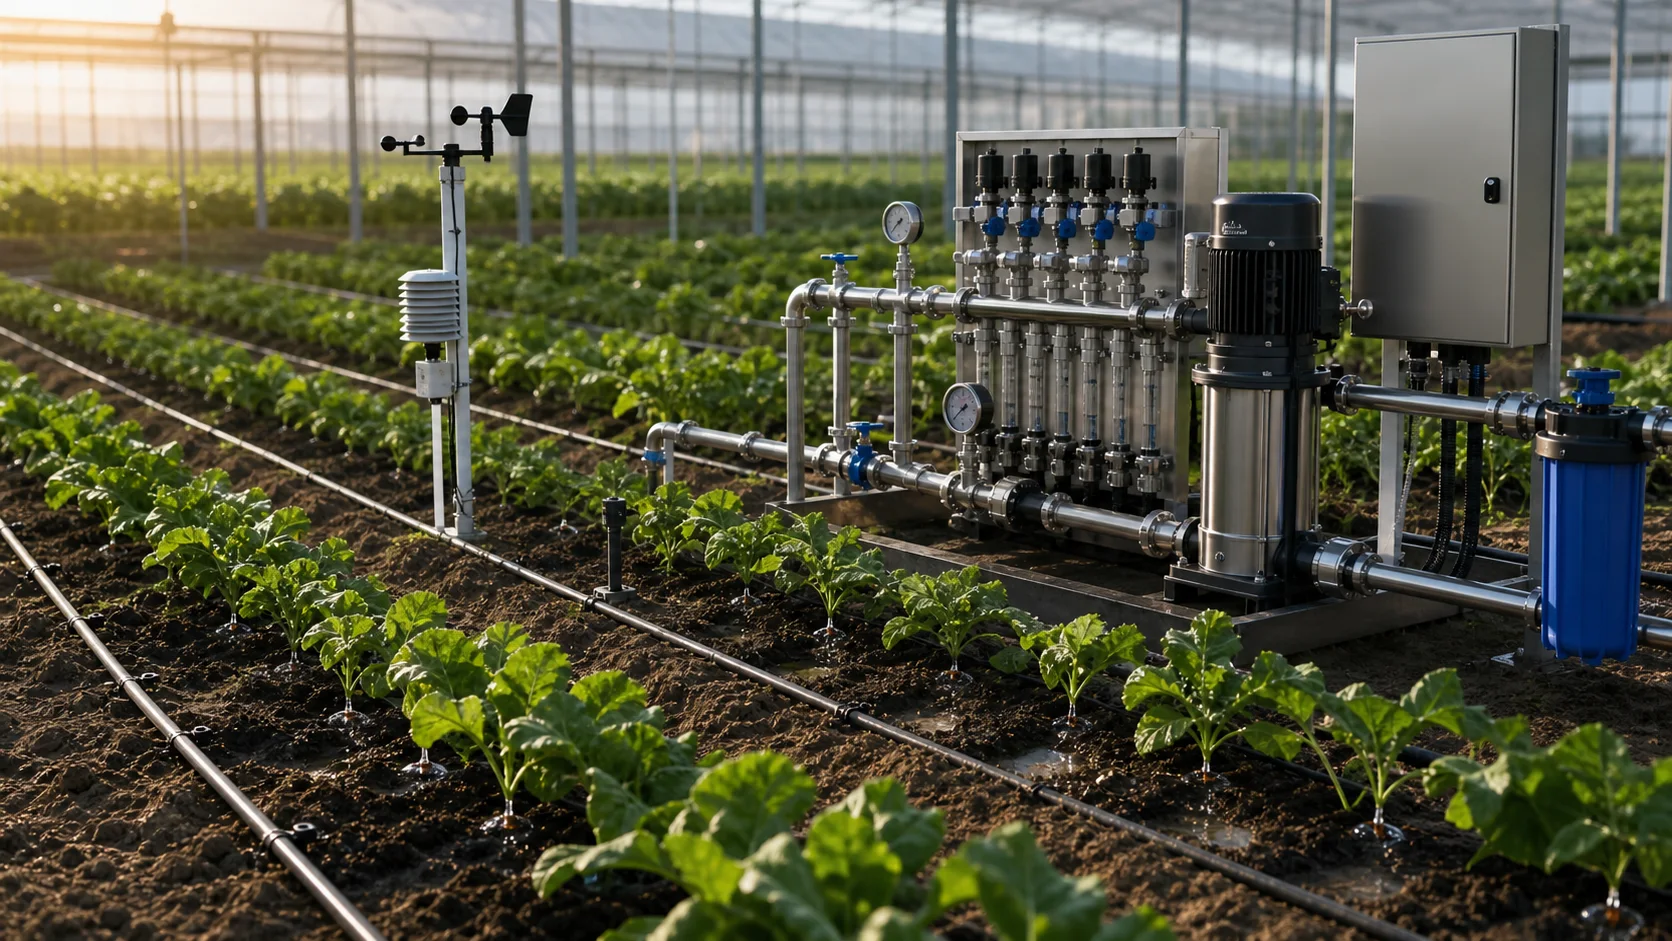
Fixed schedules were replaced by zone-based irrigation recipes using soil, flow, pressure and fertigation data.
Read the story → ANONYMOUS PROJECT
Power and auxiliary systems were consolidated into a common automation architecture that protects critical loads and guides operators.
Read the story →Share your systems, data sources and target use cases with the industrial data engineering team.
Request a data architecture review Your request is routed directly to the relevant engineering team.
Engineering confidence with Oskon.
Leave your details and our expert engineers will contact you for a preliminary consultation tailored to your needs.