


Consumption and load profile
Energy consumption, active power and demand data are monitored alongside downtime, shift patterns and equipment operating information.
Make production energy use visible and connect it with process control and production data. Explore Oskon’s engineering approach to identifying energy efficiency opportunities, implementing improvements and providing reliable data for industrial decarbonisation.
Explore the solution
Knowing a factory’s total consumption is the starting point. The real opportunity is to understand which line uses that energy, for which product and under which operating conditions, then use that insight to inform control decisions on the plant floor.
Decarbonisation means reducing the greenhouse gas emissions associated with an activity. In industry, this involves reducing energy demand, improving processes and, where appropriate, moving towards energy sources with lower emissions.
Oskon’s expertise in automation, process control and industrial data integration provides the foundation for an engineering approach that connects energy data with production. Measurement points, control scenarios and performance indicators are assessed together in the context of the facility’s existing infrastructure.
The aim is to reduce unnecessary consumption and track the effect of each improvement while respecting production capacity, product quality and safety requirements.
Alongside “How much energy did we use this month?”, ask “How much energy do we need to make the same product under the same quality conditions?”
A measurement structure extending from the main meter to critical equipment brings electricity, fuel and utility data onto a common timeline. This helps distinguish losses and improvement opportunities within the overall total.
Energy consumption, active power and demand data are monitored alongside downtime, shift patterns and equipment operating information.
Appropriate meters are selected for fuel, steam, compressed air and water. Thermal energy calculations use flow and the relevant temperature or pressure data.
Time synchronisation, units, missing records and measurement accuracy are checked. The boundaries of the main meter and submeter measurements are clearly defined.
Meters, sensors and existing controllers.
Industrial communications suited to the existing infrastructure.
Connections between SCADA, historical data and MES/MOM.
Indicators, alarms, control and follow-up.
The data acquisition architecture is designed around the OT network’s access and security rules. Monitoring access and permission to control the process are assessed separately.
A monitoring screen makes opportunities visible. Savings emerge when a measured opportunity is translated into a suitable control strategy, equipment improvement or operating practice.
Fixed operation regardless of demand, unnecessarily high pressure or flow and unsuitable operating points are reviewed. Process-appropriate speed control and control-loop settings are assessed.
Data to monitor: power, speed, flow, pressure and operating time.Air demand outside production hours, pressure levels and compressor loaded or idle running times are compared. Priorities are identified for leak repair and sequencing control.
Data to monitor: electricity consumption, air flow, pressure and load state.Recipe steps, temperature profiles, hold times and rework requirements are considered together. Control improvements are designed to preserve validated process conditions for the product.
Data to monitor: fuel or energy, temperature, batch, cycle and quality results.Cooling demand, ambient conditions and equipment loads are assessed together. Pump and fan management, setpoints and start-up sequences are reviewed to identify unnecessary operation.
Data to monitor: electricity, inlet and outlet temperatures, flow and ambient conditions.Idle lines, frequent stops and starts, scrap and repeat production are linked to energy data. Appropriate standby scenarios and opportunities to improve production flow are investigated.
Data to monitor: work order, machine state, good output, scrap and kWh per product.Measurement gaps, ageing control hardware and software structures that are difficult to maintain are reviewed. Upgrades are planned in stages around maintainability, data access and energy performance objectives.
Data to review: equipment inventory, communications, shutdown windows and baseline performance.Safety functions, product quality, capacity, maintenance needs and acceptance criteria are considered together for each application. Improvement potential is established using site data.
Consumption may fall when production decreases. Energy performance is assessed against a comparable baseline that takes account of output, product mix, operating hours and, where relevant, weather conditions.
The financial value of the energy difference is calculated using the applicable tariff and relevant operating costs. Simple payback is assessed by dividing the investment by the annual net savings, with maintenance and operating-hour assumptions stated explicitly.
Unit consumption is compared under similar product and process conditions.
Energy use that continues during standby and unplanned downtime is monitored.
Simultaneous loads and peak demand are assessed separately from energy consumption.
Decarbonisation work tracks energy consumption and greenhouse gas emissions using separate indicators. Emissions calculations specify the energy type, reporting boundary, period and appropriate emission factor.
Sources such as fuel use in a boiler or furnace controlled by the organisation. Fuel data provides input for the relevant calculations.
Indirect emissions associated with purchased electricity, steam, heating or cooling. This is one of the areas directly informed by energy measurement.
Other indirect sources, such as purchased materials, transport and product use. A corporate inventory requires data beyond energy meters.
Location-based and market-based electricity accounting use different inputs. Broad reduction claims should be based on factors with a documented source and reporting period. Electrification is also assessed against the energy source and total emissions impact. Measurement infrastructure supports reporting; independent verification and certification remain separate processes.
COP31 is scheduled to take place in Antalya, Türkiye, from 9 to 20 November 2026. Green industrialisation, the clean energy transition and electrification on the official agenda are closely connected with energy and process improvement work in industrial facilities.
Turning industrial decarbonisation objectives into practical projects requires an understanding of where consumption occurs, what the process needs and how results will be tracked. This is where the agenda connects with Oskon’s engineering disciplines.
Conference information: UNFCCC / COP31 · Agenda: Official COP31 Türkiye website
Adopted at COP21 in 2015, the Paris Agreement provides an international framework for addressing climate change. It aims to keep the increase in global average temperature well below 2°C above pre-industrial levels and pursue efforts to limit the increase to 1.5°C.
Under the Paris Agreement, countries set out their climate actions through nationally determined contributions (NDCs). Energy efficiency and emissions reduction work in industrial businesses are among the practical areas of this transition.
At facility level, the starting point is to establish a reliable baseline, monitor energy and emissions data, implement suitable improvements and assess progress. This connects decarbonisation objectives with everyday operating decisions.
Read about the Paris Agreement on the UNFCCC websiteEvery facility can start with a scope that fits its needs. A critical line or utility system can be selected first, with measurement and control expanded once the results have been assessed.
Energy sources, production structure, existing automation and operating constraints are reviewed. The line or process to be addressed is clearly identified.
Output: priority areas and an initial scope.The adequacy of existing data is assessed and metering or integration needs are identified. The reference period and performance indicators are defined.
Output: measurement points, a data list and a comparison method.Control improvements and investment options are assessed against potential benefits, implementation cost, shutdown requirements and process risk.
Output: implementation priorities with explicit assumptions.Integration and control changes are carried out within the planned operating window. Functions, safety requirements and acceptance criteria are checked.
Output: a commissioned scope and operating documentation.Performance is monitored under comparable conditions. Deviations are investigated, and responsibilities, alarm thresholds and periodic reviews are established.
Output: a performance assessment and the next improvement steps.Energy performance gains context when plant-floor control, production management and data infrastructure are considered together. Explore the related Oskon solutions.
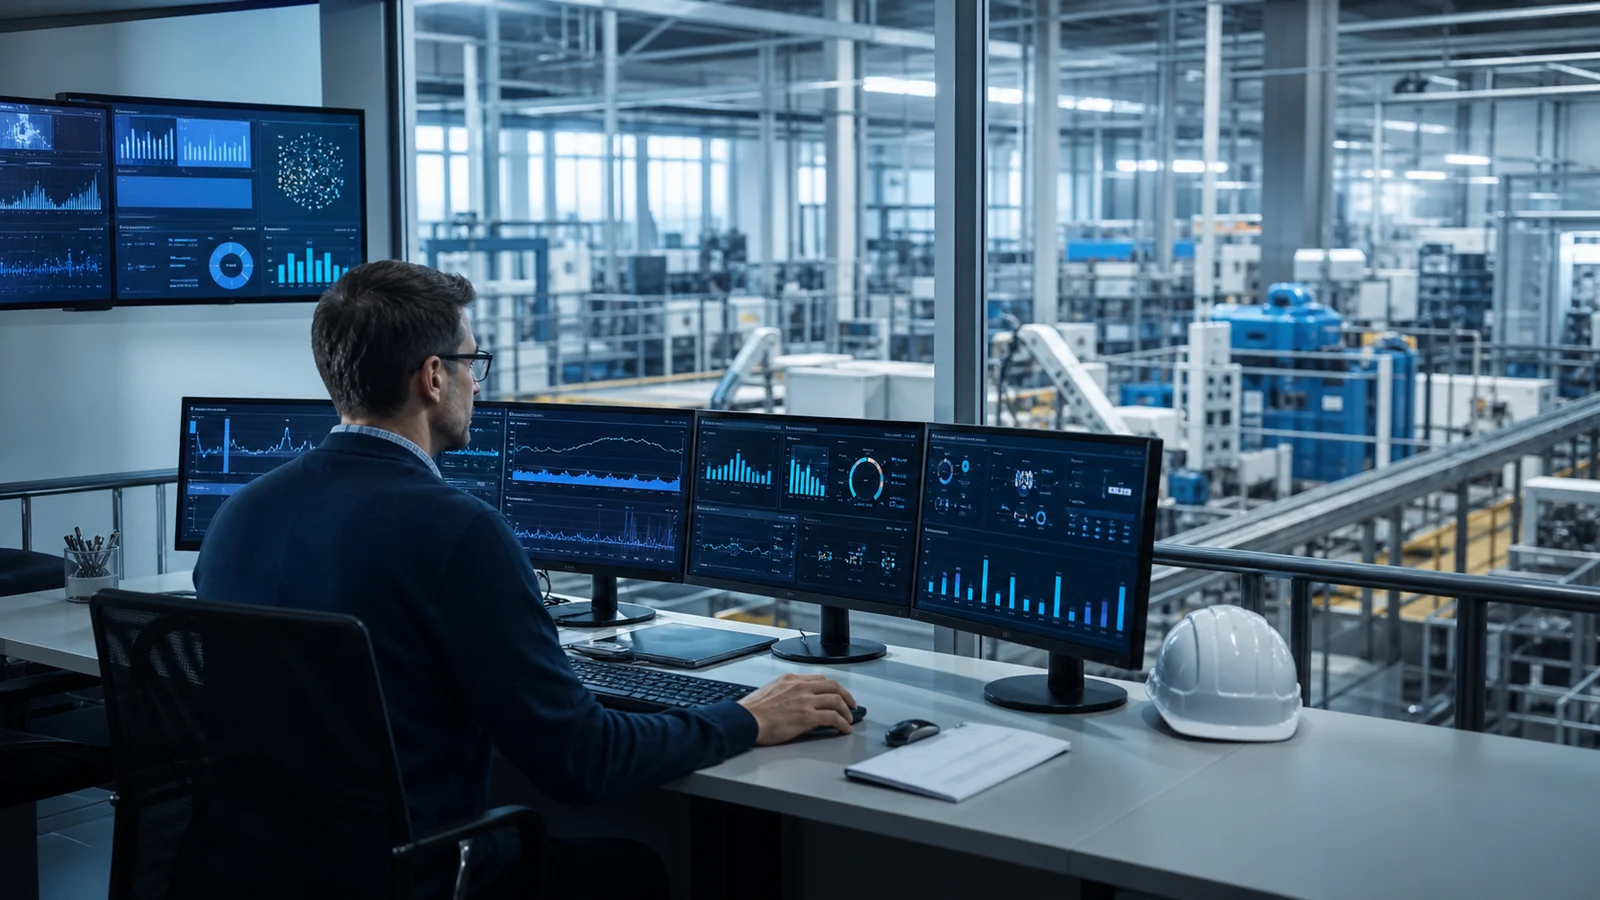
Explore infrastructure that connects energy and plant-floor data with production context.
Explore the solution ↗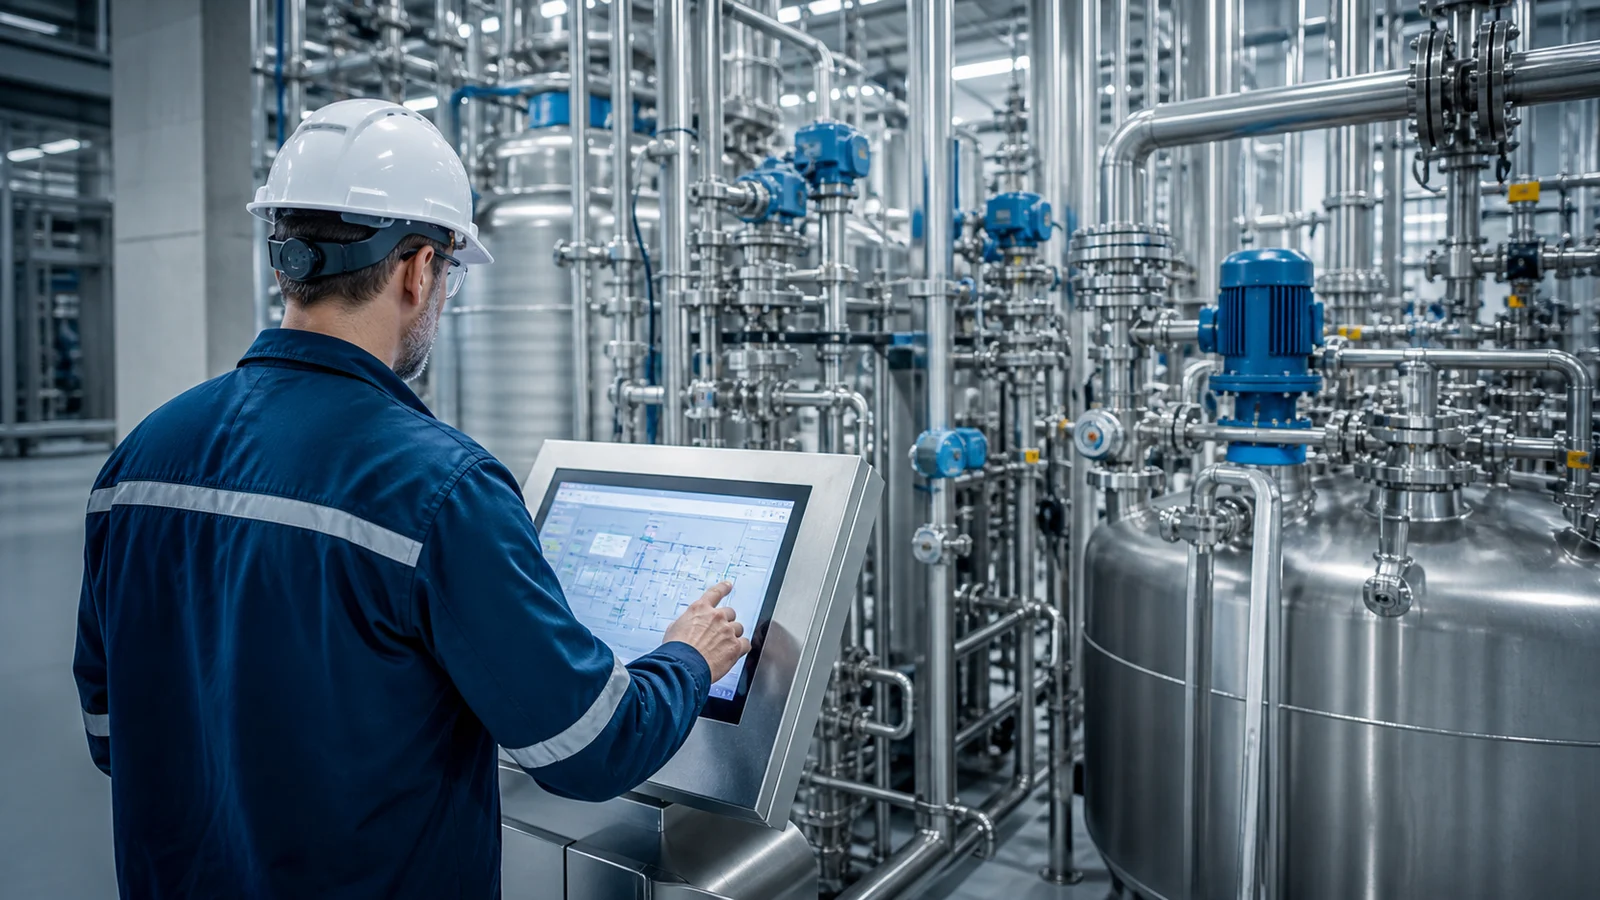
Assess control strategies, recipes and operating conditions together.
Explore the solution ↗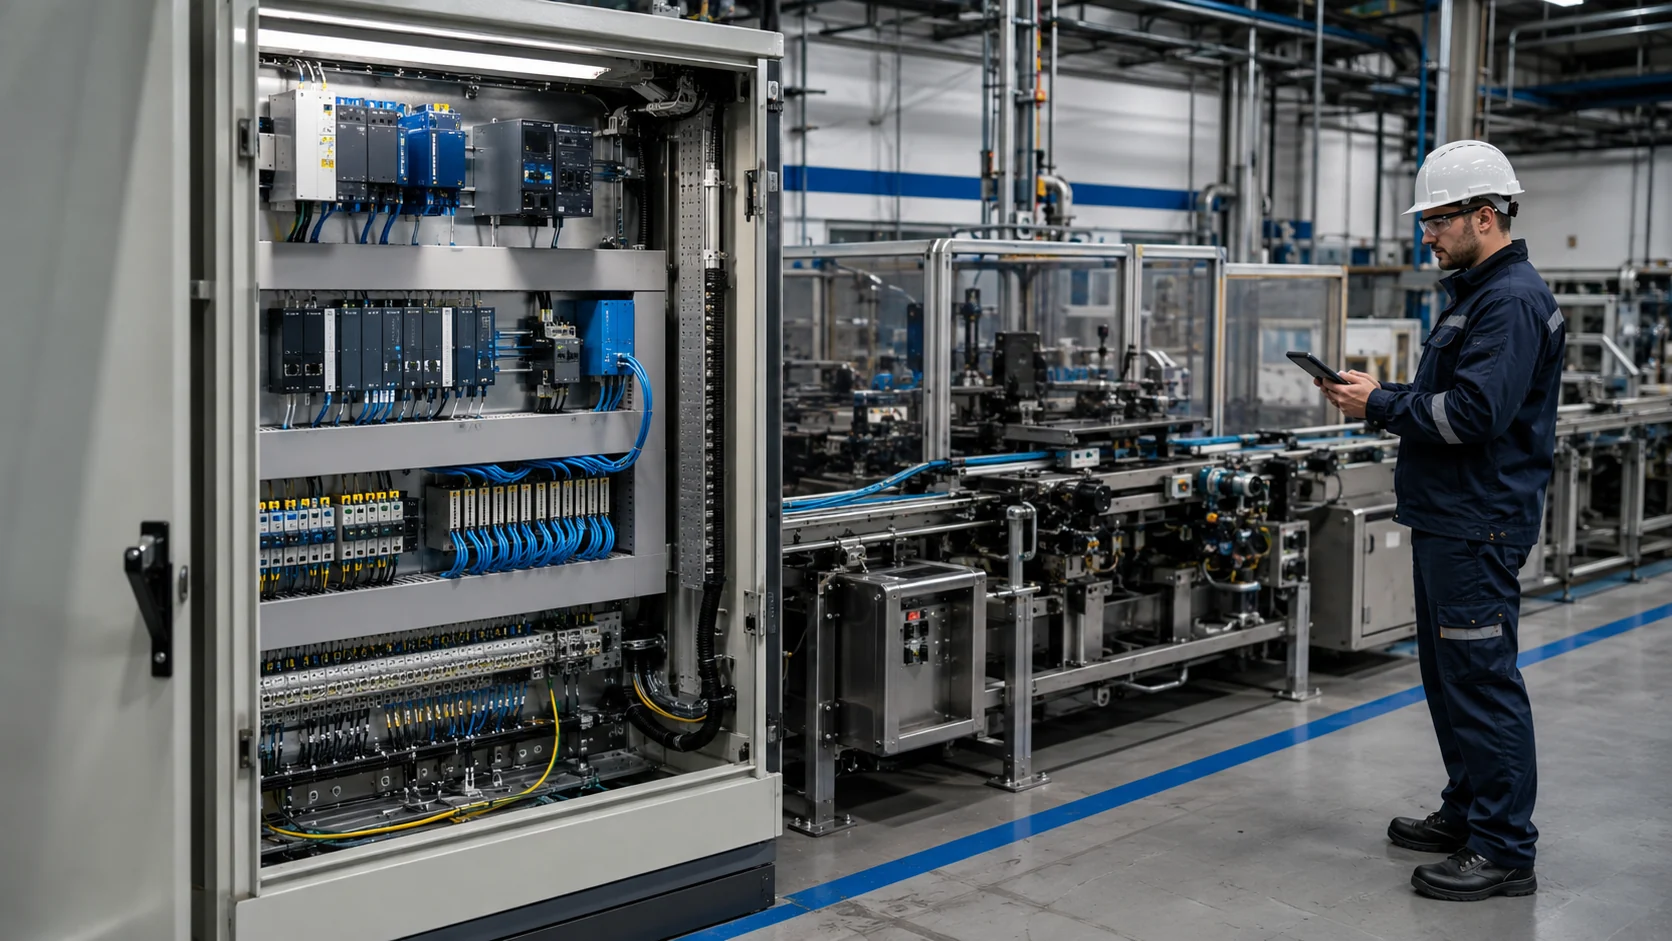
Explore improvements to measurement, data access and control infrastructure in existing facilities.
Explore the solution ↗The right scope is based on the facility’s existing data and production objectives.
Industrial decarbonisation means reducing the greenhouse gas emissions associated with operations. It brings energy efficiency, process improvements and suitable energy options with lower emissions into one transition process.
Monitoring makes consumption and deviations visible. To achieve savings, that information needs to lead to a control change, maintenance action or operating practice. Its effect is measured after implementation.
Existing communication interfaces, controllers and meters are reviewed. Where suitable data is unavailable, additional measurement or gateway options are assessed. Scope and feasibility are established through a site assessment.
A general savings percentage would be unreliable without sound baseline data. Potential is calculated after reviewing load profiles, operating hours, process conditions, the existing control structure and investment options.
Measurement records, performance indicators and improvement tracking can support the data requirements of an energy management system. ISO 50001 also covers policy, responsibilities and continual improvement. Installing a monitoring system alone does not establish conformity or certification.
Energy and carbon indicators are assessed separately. Carbon impact depends on energy type, the appropriate emission factor, accounting method and reporting boundaries. A change in energy source or product mix can produce different emissions outcomes for the same consumption difference.
Reading existing data, installing a new meter and changing process control have different implementation requirements. Shutdown windows for electrical or mechanical work are planned around the facility’s safety and operating procedures.
A useful starting point is the previous 12 months of energy consumption and production output, shift patterns, major energy users and existing automation or meter lists. Available single-line diagrams, process flows and performance reports help inform the assessment.
Reference information on energy management, energy intensity and greenhouse gas accounting.
Tell us briefly about your operation so we can establish the right next step together.
Discuss your requirements Your request is routed directly to the relevant engineering team.
Engineering confidence with Oskon.
Leave your details and our expert engineers will contact you for a preliminary consultation tailored to your needs.